
Company
Pano AI
Role
Lead Product Designer
The team
1 TPM, 2 PMs, 2 designers, 8 engineers, 1 QA engineer
Timeline
May–June 2026 (Round 1 co-design)
August 2026 – present (Round 2 and MVP build)
Context
Most customers know Pano for detection, but detection is only one step in how utilities handle wildfire. Before a fire starts, they decide whether to cut power in dangerous weather. After it starts, they dispatch crews and manage the response. There's an opportunity for Pano to be a platform that supports many of those workflows, and it's a big one. California's largest utility alone plans to spend about $18.9 billion on wildfire mitigation from 2026 to 2028.
Historically, Pano has served utilities, fire agencies, forestry teams, and private landowners, whose workflows and needs differ a lot. To better fully design around utility needs, we're building a dedicated platform just for them. Timing is imperative, since other companies are racing to become the platform utilities rely on.
I led design on the Disaster Intelligence Platform, Pano's new platform for utilities. I started with early concepts then focused on one part of it: incident management.
Pano's head of product strategy & research ran initial customer research and identified three big bets to pursue:
Executive dashboard
Utility leadership needs one place to see fire risk, weather, and any new fires or outages overnight. That information lives in different systems, so staff piece updates together by hand and the updates go stale.

"Help me see what's happening faster, in one place, and help me prove to regulators and leadership that this spend is worth it."
– VP, Customer Experience
PSPS decision support
A Public Safety Power Shutoff (PSPS) is when a utility turns off power ahead of dangerous weather, like strong winds in dry conditions, so its lines can't spark a fire. It's a hard, costly, and unpopular call, since thousands of people, including hospitals, can lose power. Utilities need help deciding when to do it and which lines to shut off, with more confidence and a decision they can defend.
"How it's done today is very manually — the incidents you avert, when you do a PSPS, it's all very manual."
– Utility President
Incident management
When a utility's Pano camera spots smoke, its wildfire team gets an alert. Someone needs to be looking at it, deciding whether it's a real fire, and choosing whether to send a crew or cut power. Today that happens over spreadsheets, group texts, and phone calls. Utilities call these detections incidents, since some turn out not to be fires. They need to know if their assets caused the fire or would be affected by it, and to report back to regulators and legal with a record of what happened.
Today, teams use Pano like this: Alert → Confirm → Leave.
The goal is to keep them in Pano for the whole response: Alert → Investigate → Confirm and triage → Coordinate → Monitor → Close.
"I see camera [detections] come through all day… hopefully somebody's seen that and they're going into responding." – Director, Wildfire Mitigation & Response
1st Iteration Designs
I was pulled onto the project with less than two weeks to get designs ready to show two customers when we visited them in person. Both had agreed to be co-design partners who would give us continuous feedback and help shape the product. We picked them because one had a well-developed wildfire program and the other was still building theirs, so the designs would fit utilities at both stages. Onsite, we worked in a forward-deployed way, which meant sitting with C-suite execs, wildfire mitigation directors, and specialist operators, and coming back the next day with updated revisions based on their feedback.
Normally I might start with wireframes, but since these designs were going straight in front of customers, I went directly to high fidelity. They were high-level concepts, and I packed in more ideas than we'd build on purpose. I designed in Figma because it was the fastest option under the time crunch. Claude Design had launched less than a month earlier, and using it meant writing a prompt, waiting, and fixing bugs.
There was no PM yet, so I mapped out the user needs myself from the initial research.

Executive Dashboard Designs

PSPS Decision Support Designs

Incident Management Designs
2nd Iterations: Focusing on Incident Management
We got so much incredible feedback from the customer visits. Before I continued iterating, a PM and a second product designer joined the project in July. The other designer took PSPS decision support and I focused on incident management. While the two of them ramped up, I worked on several other top-priority projects, then came back to incident management at the end of August. I built a second prototype based on feedback, this time entirely in Claude Design. The designs were still high-level concepts as we wanted to check we were on track before committing to building anything.

Incident Triaging Designs

Incident Map Designs

Beyond those requests, the page itself needed a different structure. The current incident details page is built around where a camera first spotted the smoke. The default view stays on that spot even as the plume moves. Today, if a fire has two smoke plumes, they show up as two separate incidents, which isn't how utilities or incident managers think about a fire. I redesigned the page to tell the whole story of a fire:
• Added a timeline that runs across the whole page, from before the fire started, to what's happening now, to where it's forecast to go.
• Added points of interest, like nearby assets, since those are what utilities care about most. Clicking one shows it through the closest camera. Each tower has two 360-degree cameras, so no camera has to physically move. The page picks the closest camera and turns the view toward the asset.
Incident Incident Page Designs
Getting feedback on Round 2
When one customer saw the prototype, they joked that we'd already built what they wanted. Their reaction, along with the feedback below, gave us enough confidence in the direction to start deciding what to build first.
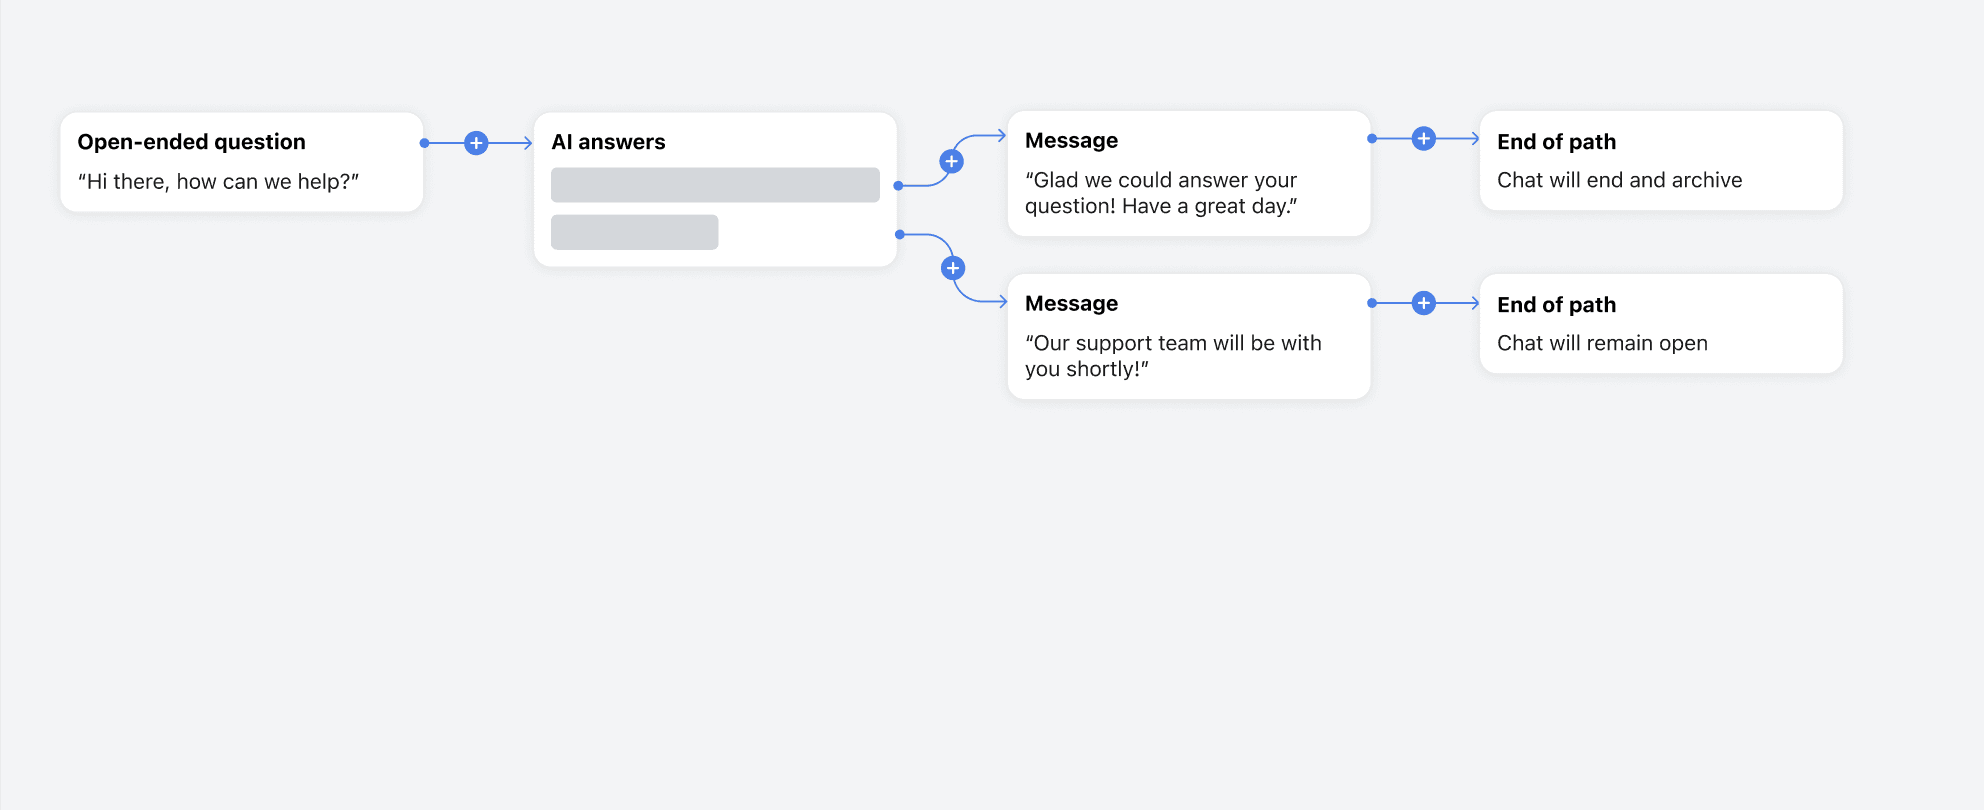
• We learned that each utility assigns fires differently. For one customer, the fire specialist on shift owns triaging each fire, and a backup steps in when they're busy. At another, regional leads triage fires in their own region during work hours. After hours, one person covers everything on a rotating schedule, a lot like being on call.
• Positioning the tool around "did we cause this fire?" doesn't work. That information is so sensitive that utilities keep it out of documented systems entirely, sticking to notebooks and phone calls.
Mapping each utility's response
To pull together everything we'd learned, I mapped how each utility responds to a wildfire, stage by stage, showing who steps in at each stage and what their role is.

Release 1: Incident Management Table and Kanban
Rollout plan
One customer is choosing between Pano and a competitor as their platform for incident management beyond detection, and we expect their decision by February. The competitor is also selling this same position to other utilities. Incident management is a new workflow for Pano, so we're releasing it in small versions on the way to an MVP in February, when the beta starts. Each version goes out as soon as it's ready, so we can show progress, build confidence, and show we're listening. That customer can test each release and give early feedback, so we can adjust as we go.
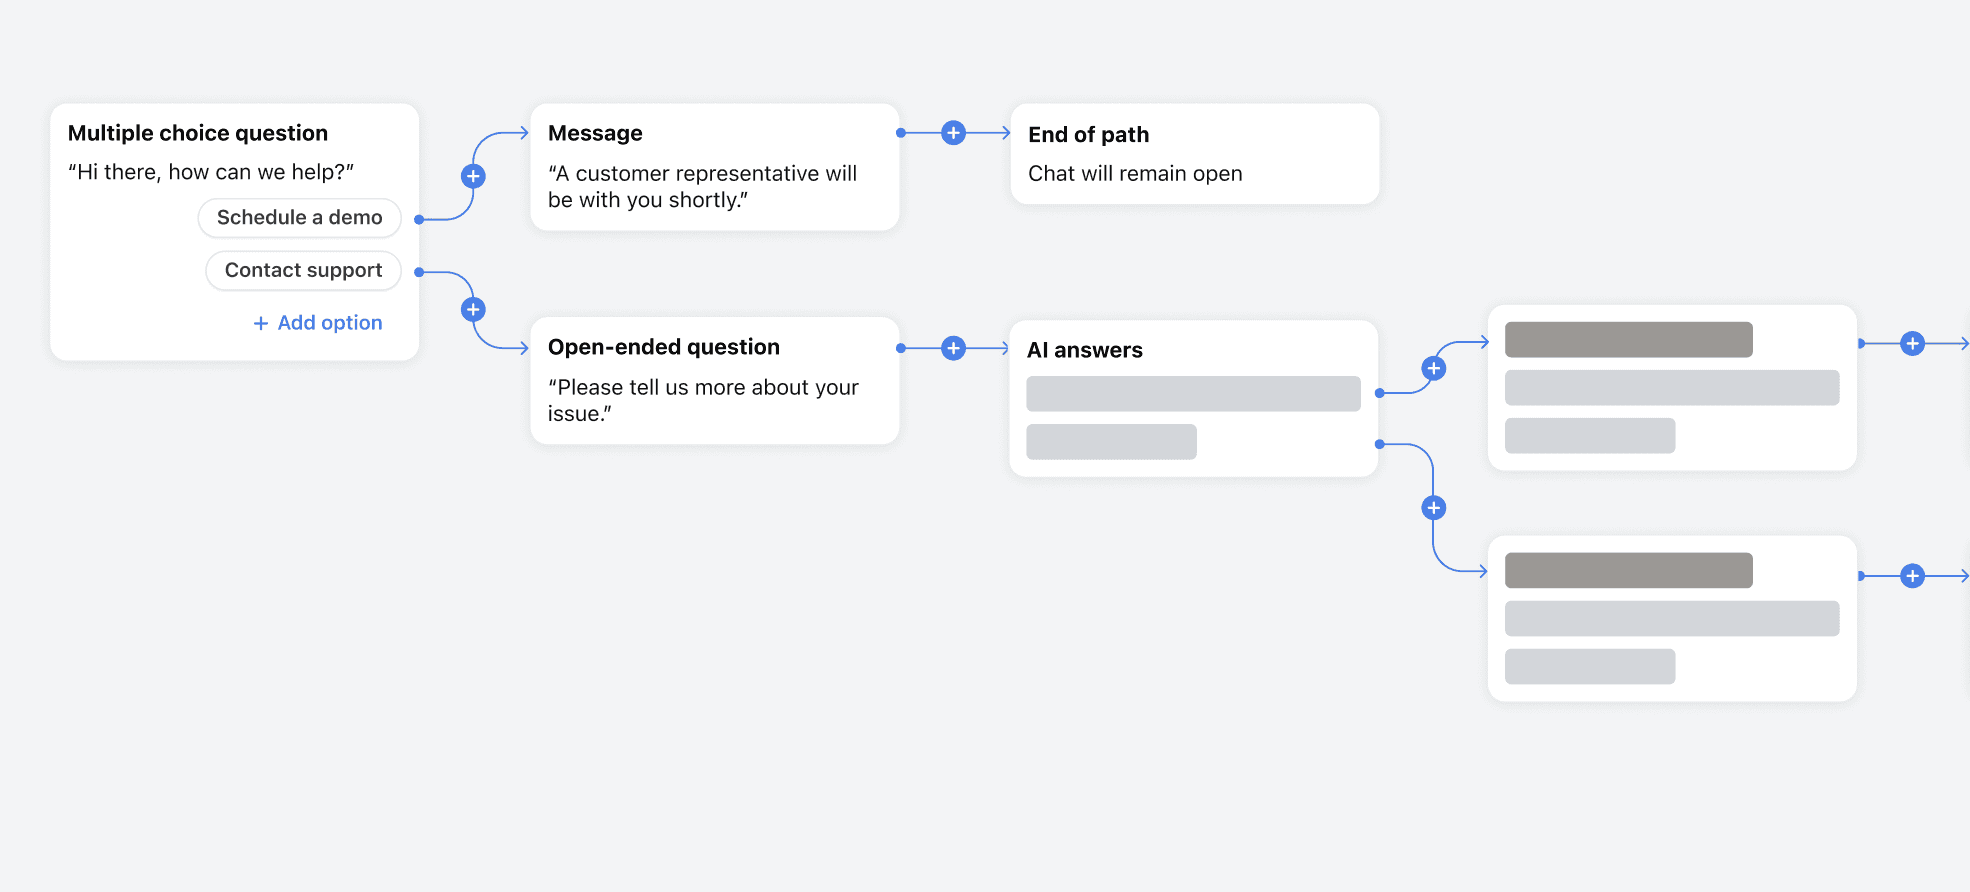
After two rounds of high-level concepts, we needed to build a real product customers could use in beta. A new PM joined to lead the table and kanban work. The pain point we heard repeatedly, and one our competitor doesn't support, is triaging new fires. Wildfire operators need to assign themselves to incidents and choose what action each one needs.
User stories
These are the jobs the feature had to support.
• As a wildfire response manager, I want a high-level view of each fire's stage, such as under investigation, being monitored, or dismissed.
• As a wildfire response manager, I want to make sure every new fire has a point person triaging it in a timely manner.
• As a wildfire operator, when a new fire appears, I want to quickly tell whether it only needs passive monitoring, like a planned burn, or an active response.
• As a wildfire operator, I want to dismiss false alarms and close contained fires, so my attention is focused on the fires and tasks that matter.
Key decision: Choosing a UI pattern
For the main triaging view, I first considered a list of incidents with the map beside it, where users could click a new incident to assign and triage it. But customers told us the map is too noisy to be the main place they triage.

In earlier customer talks, customers responded really well to the kanban board. But I could see that view getting harder to use with tons of incidents, and customers who work in spreadsheets already follow a table format.
We're waiting on customer feedback to decide whether to build the table or the kanban board (or both).
05. DESIGN & ITERATION
Release 1 collaboration and handoff
Handoff
I'll be doing the handoff in a few forms, so engineers have what they need:
• An interactive prototype in Claude Design, to click through the flows.
• The prototype code, pushed as a draft pull request for engineers to review.
• A developer mode in the prototype, where clicking on a component gives copyable engineering specs.
• A handoff canvas in Claude Design, documenting the flows with annotations.
• A markdown file for the engineers' AI coding tools, based on design specs and annotations, so their tools can check that they've covered every state I specified.
Once engineers have built from these, I plan to follow up with them on what worked and what didn't, so the next handoff is better.
A newish design system
Because this was a new product, we had the chance to refresh the design system. For speedier implementation, we kept using MUI, the component library our engineers already build with, along with our colors, fonts, and icons, but gave components a more modern look and feel. I had Claude build a Storybook-style view showing every component and state the kanban board and table needed. (Storybook is where our coded components and all their states are documented.) In our existing Storybook, states aren't always documented thoroughly, so I wanted this fresh version to set a precedent of covering every state from the start, and to become the source of truth for the new platform's design system, in code instead of Figma. I'm handing off the Storybook code to engineers as a draft pull request, so they can pass it to their AI coding tools.
Measuring Success
The MVP is still being built, but here's data we will be tracking:
Customer sentiment
Ongoing feedback from our customer design partners.
Supporting metrics
How long it takes a new alert to get an assigned owner
Weekly active users on the customer's wildfire team
The share of incidents that get closed instead of left to go stale
The share of incidents whose detail page gets opened
Business outcomes
Customers retire their current tracking spreadsheets
Customers use fewer systems during an incident
Customers choose us as their triaging platform over competitors
What's Next
Alongside Release 1, I kept exploring what the product could become after it to make sure the design would scale to what comes next.
Adding more data to the tables and cards to give utilities more information from the get-go
Adding sorting, filtering, and search
A full incident details page. Weather, nearby assets, cameras, and spread projections for each fire in one place, laid out for how utilities investigate, monitor, and decide whether to cut power.
Threat levels each utility sets. Fires with threat levels corresponding to the distance to the utility's assets.
Learnings and reflections
• I'd love for designers to own more of the design system code that is the source of truth. Next I want to work out how designers could push to Storybook themselves.
• New PMs and a second designer joined while the direction was still taking shape, and each arrived with fresh questions, like why we chose a kanban board. I learned to treat those questions as a check on my own thinking, since anything I couldn't explain clearly was a decision I hadn't fully made.